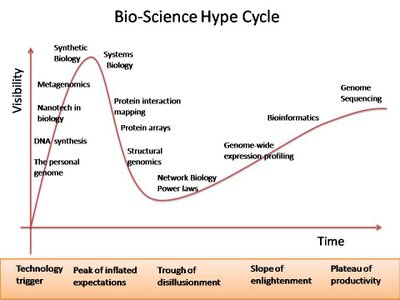
Some ten years ago analysts at Gartner, an information and technology research and advisory company, suggested that the acceptance of new information technologies tend to follow a ‘hype cycle’. First comes a trigger phase with intitial curiosity, then a peak with wide-spread publicity and inflated expectations (the hype), followed by a phase of disillusionment when the new technology fails to meet the expectations. Then comes a slow recovery phase; the press has forgotten all about it, but some business begin to see the value in it. And, finally, the new technology (eventually) becomes main-stream and accepted (no hype this time).
Gartner’s hype cycle thesis has mainly been discusssed in relation to marketing strategies for new information and communication technologies. I haven’t seen it applied graphically to medical technologies (my favourite med&tech site, medgadget, hasn’t mentioned it) until yesterday when I found Pedro Beltrao’s playful graph on Public Rambling:

I wasn’t surprised that Pedro puts systems biology at the peak of hype: lots of attention and expectations, but not much delivery so far. What about stem cell research or regenerative medicine generally?
I don’t think one should take hype cycle graphs too seriously. They are not backed up empirically in any systematic way, but rather the result of technology analysts’ more or less subjective judgement. However, they are probably not worse off than what most financial and marketing analysts do, although it would be great to see a better founded analysis, e.g., of the kind that Renaissance Technologies‘s employees might be able to make. Sociologists of expectation, like Nik Brown at University of York and Arie Rip at University of Twente have also made some interesting references to hype cycles.
I believe the great value of the hype cycle thesis is its graphic qualities which invite spectators to join in the effort to add technologies to the graph (like when I immediately ask where stem cell technology fits into Pedro’s picture). In other words, the graph functions as an invitation to participate in a collective analytical game, whereas a textual analysis would not have this evocative power.
(Can someone recommend a cyberconferencing software system which would allow participants to add new technologies to graphs like these online, and thus gradually refine the analysis? Like a Delphi study).
